Product Specification
PE43503
Page 2 of 11
?008-2009 Peregrine Semiconductor Corp. All rights reserved.
Document No. 70-0252-05 UltraCMOS" RFIC Solutions
-1
0
1
2
0
4
8
12
16
20
24
28
32
Attenuation Setting (dB)
200MHz
900MHz
1800MHz
2200MHz
3000MHz
4000MHz
5000MHz
6000MHz
-2
-1.5
-1
-0.5
0
0.5
1
1.5
2
0
4
8
12
16
20
24
28
32
Attenuation Setting (dB)
200MHz
900MHz
1800MHz
2200MHz
3000MHz
4000MHz
5000MHz
6000MHz
-2
-1.5
-1
-0.5
0
0.5
1
1.5
2
0
1000
2000
3000
4000
5000
6000
Frequency (GHz)
1dB State
2dB State
4dB State
8dB State
16dB State
31dB State
900 MHz
2200 MHz
3800 MHz
5800 MHz
5
10
15
20
25
30
0
35
5
10
15
20
25
30
0
35
Attenuation State
ttenuation
Table 1. Electrical Specifications @ +25癈, V
DD
= 3.3 V or 5.0 V
Performance Plots
Parameter
Test Conditions
Frequency
Min.
Typical
Max.
Units
Frequency Range
9 kHz
6 GHz
Attenuation Range
1 dB Step
0 31
dB
Insertion Loss
9 kHz d 6 GHz
2.4
2.9
dB
Attenuation Error
0dB - 31dB Attenuation settings
0dB - 21dB Attenuation settings
22dB - 31dB Attenuation settings
0dB - 31dB Attenuation settings
9 kHz d 4 GHz
4 GHz d 6 GHz
4 GHz d 6 GHz
4 GHz d 6 GHz
?0.3+3%)
+0.4+9%
+2.4+0%
-0.2-3%
dB
dB
dB
dB
Relative Phase
All States
9 kHz d 6 GHz
72
?
P1dB
(note 1)
Input
20 MHz - 6 GHz
30
32
dBm
Input IP3
Two tones at +18 dBm, 20 MHz spacing
20 MHz 6 GHz
+58
dBm
Return Loss
DC d 6 GHz
17
dB
Switching Speed
50% DC CTRL to 10% / 90% RF
650
ns
Typical Spurious Value
1 MHz
-115
dBm
Video Feed Through
10
mVpp
Settling Time
RF settled to within 0.05 dB of final value
RBW = 5 MHz, Averaging ON.
4
祍
RF Trise/Tfall
10% / 90% RF
400
ns
*Monotonicity is held so long as Step-Error does not cross below -1
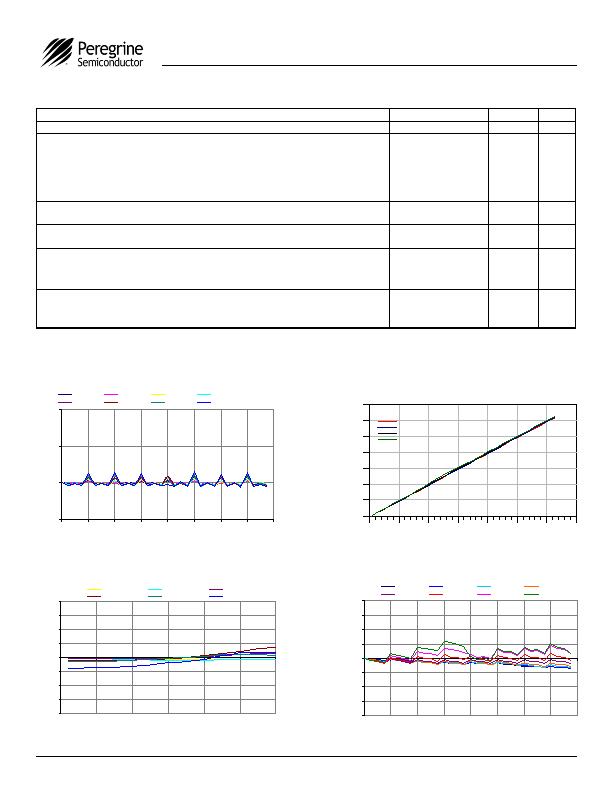
Figure 3. 1dB Step Error vs. Frequency *
Figure 4. 1dB Attenuation vs. Attenuation State
Figure 5. 1dB Major State Bit Error
Figure 6. 1dB Attenuation Error vs. Frequency
Note 1. Please note Maximum Operating Pin (50&) of +23dBm as shown in Table 3.
-
发布紧急采购,3分钟左右您将得到回复。
相关PDF资料
PIC12LF1840T48AT-I/ST
MCU 8BIT 7KB FLASH 14TSSOP
PPG101A1RD
DETECTOR RTD TF 100 OHM +/-0.06%
PPG101B1RD
DETECTOR RTD TF 100 OHM +/-0.12%
PPG101C1RD
DETECTOR RTD TF 100 OHM +/-0.24%
PPG102A1RD
DETECTOR RTD TF 1K OHM +/-0.06%
PPG102B1RD
DETECTOR RTD TF 1K OHM +/-0.12%
PPG102C1RD
DETECTOR RTD TF 1K OHM +/-0.24%
PPG501A1RD
DETECTOR RTD TF 500 OHM +/-0.06%
相关代理商/技术参数
PE4351
制造商:PASTERNACK 制造商全称:Pasternack Enterprises, Inc. 功能描述:BNC Male Connector Crimp/Solder Attachment For RG214, RG9, RG225, RG393
PE4352
制造商:PASTERNACK 制造商全称:Pasternack Enterprises, Inc. 功能描述:GR874 Sexless Connector Crimp/Solder Attachment For RG214, RG9, RG225, RG393
PE4353
制造商:PASTERNACK 制造商全称:Pasternack Enterprises, Inc. 功能描述:SMA FEMALE BULKHEAD SOLDER ATTACHMENT FOR RG55 RG58 RG142 RG223 & RG400
PE4354
制造商:PASTERNACK 制造商全称:Pasternack Enterprises, Inc. 功能描述:SMA Male Bulkhead Connector Solder Attachment Solder Cup Terminal, .235 inch D Hole
PE4356
制造商:PASTERNACK 制造商全称:Pasternack Enterprises, Inc. 功能描述:SMB PLUG SOLDER ATTACHMENT FOR RG405 PE-SR405AL & PE-SR405FL
PE4360
制造商:PASTERNACK 制造商全称:Pasternack Enterprises, Inc. 功能描述:SMB JACK SOLDER/CLAMP ATTACHMENT FOR RG405 PE-SR405AL &PE-SR405FL
PE43601
制造商:PEREGRINE 制造商全称:PEREGRINE 功能描述:RF Digital Attenuator 6-bit, 15.75dB, DC-6.0 GHz
PE43601MLI-Z
功能描述:IC RF DSA 6BIT 50 OHM 32QFN RoHS:是 类别:RF/IF 和 RFID >> 衰减器 系列:UltraCMOS™, HaRP™ 标准包装:1 系列:- 衰减值:- 容差:±1% 频率范围:0 ~ 500MHz 功率(瓦特):2W 阻抗:93 欧姆 封装/外壳:BNC 单排模块
